The Math Behind
A/B Testing
Understanding confidence intervals, conversion rates, and statistical significance
Note: If you are new to A/B testing and are looking for an easy to understand description of how A/B tests work without worrying about the math, then read: How A/B Testing Works.
The A/B Test Report
The A/B test report uses conversion and view events to calculate the confidence intervals, conversion rates, and statistical significance.
An example of an A/B test report is shown here:
| Variation | Conversions / Views | Conversion Rate | Change | Confidence |
|---|---|---|---|---|
| Variation A (Control) | 320 / 1064 | 30.08% ±2.32% | — | — |
| Variation B | 250 / 1043 | 23.97% ±2.18% | -20.30% | 99.92% ✓ |
Note: In this report significance has been reached because the confidence is above 95% and there are more than 1000 views for each variation.
- Variation: this column reports the name of the variation for a particular row
- Conversions / Views: this column reports the number of conversion events received and the number of view events received
- Conversion Rate: this column shows the percentage of views that turned into conversions as well as the confidence interval
- Change: this column reports the percentage change of the Test variation compared to the Control variation
- Confidence: this column reports the significance, or how different the confidence interval for the conversion rate for the Test variation is when compared to the Control variation (this must be at least 95% confident before being flagged as significant)
The values used in the report are calculated as noted below.
Conversion Rate and Conversion Rate Change for Variations
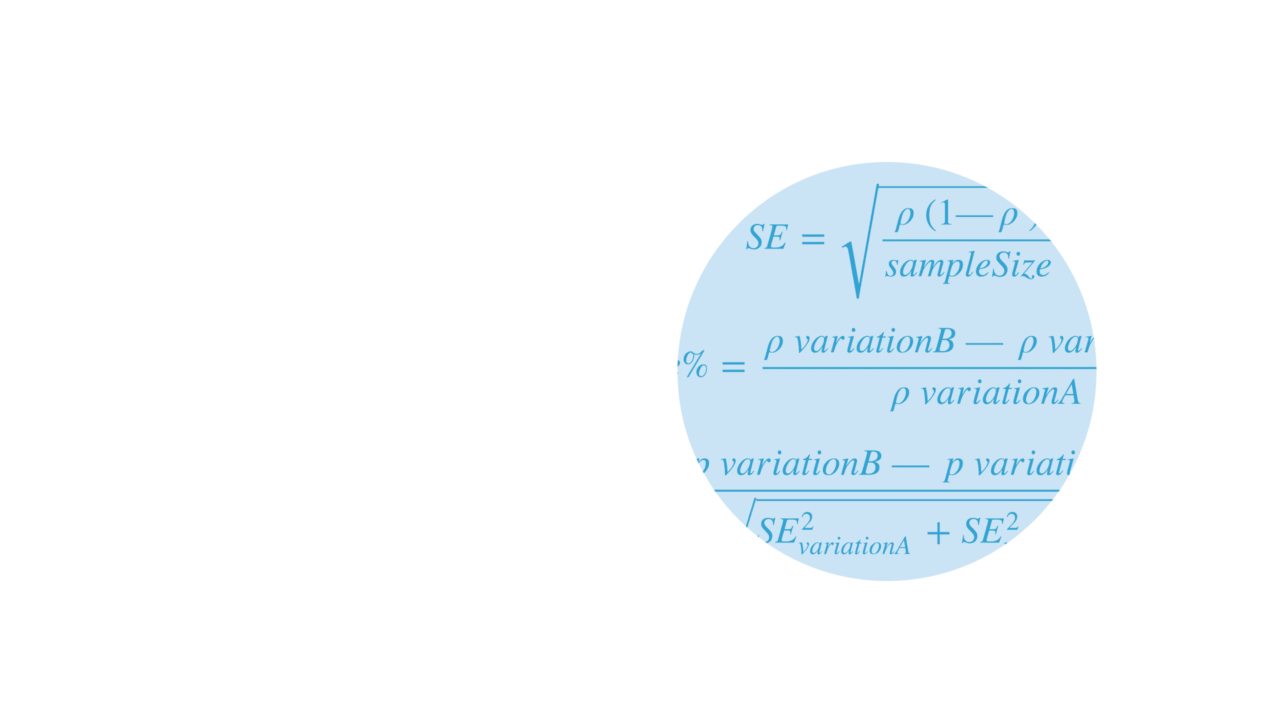
For each variation the following is calculated. Conversion rate:
For each variation the following is calculated. Conversion rate:
Confidence Intervals
A statistical method for calculating a confidence interval around the conversion rate is used for each variation. The standard error (for 1 standard deviation) is calculated using the Wald method for a binomial distribution.
This formula is one of the simplest formulas used to calculate standard error and assumes that the binomial distribution can be approximated with a normal distribution (because of the central limit theorem) http://en.wikipedia.org/wiki/Binomial_proportion_confidence_interval. The sample distribution can be approximated with a normal distribution when there are a more than 1000 views events.
To determine the confidence interval for the conversion rate multiply the standard error with the 95th percentile of a standard normal distribution (a constant value equal to 1.96).
This results in a 90% confidence that the conversion rate, p, is in the range of p ± (1.96 X SE).
Significance
To determine whether the results are significant (that the conversion rates for each variation are not different because of random variations), a ZScore is calculated as follows:
The ZScore is the number of standard deviations between the control and test variation mean values described at http://en.wikipedia.org/wiki/Zscore. Using a standard normal distribution the 95% significance is determined when the view event count is greater than 1000 and one of the following criteria is met:
1. Probability(ZScore) > 95%
2. Probability(ZScore) < 5%
Chance To Be Different
The chance to be different (displayed on the report) is derived from the Probability(ZScore) value where:
If Probability(ZScore) <= 0.5 then Chance to be different = 1- Probability(ZScore)
If Probability(ZScore) > 0.5 then Chance to be different = Probability(ZScore)
☞Arigato for reading.


