Experimentation
How A/B Testing Works
A/B testing compares two versions of something to see which performs better. Here's how it works, why confidence intervals matter, and how to avoid common mistakes.
The problem with “just change it and see”
Imagine your team wants to test whether a new checkout button increases purchases on your website. The most obvious approach: swap the old button for the new one, wait a few weeks, and compare the numbers.
Sounds reasonable. But it has serious problems. First, if the new button is worse, every single customer suffers while you wait for data. Second, you can’t separate your change from everything else happening during that period - a holiday weekend, a competitor’s sale, a viral tweet about your product. Any of those could skew the results. And third, you’d need to wait until enough customers come through, which could take a long time depending on your traffic.
A/B testing exists because of these problems. It’s a structured way to compare two options side by side, under the same conditions, without betting the farm on an untested idea.
How A/B testing actually works
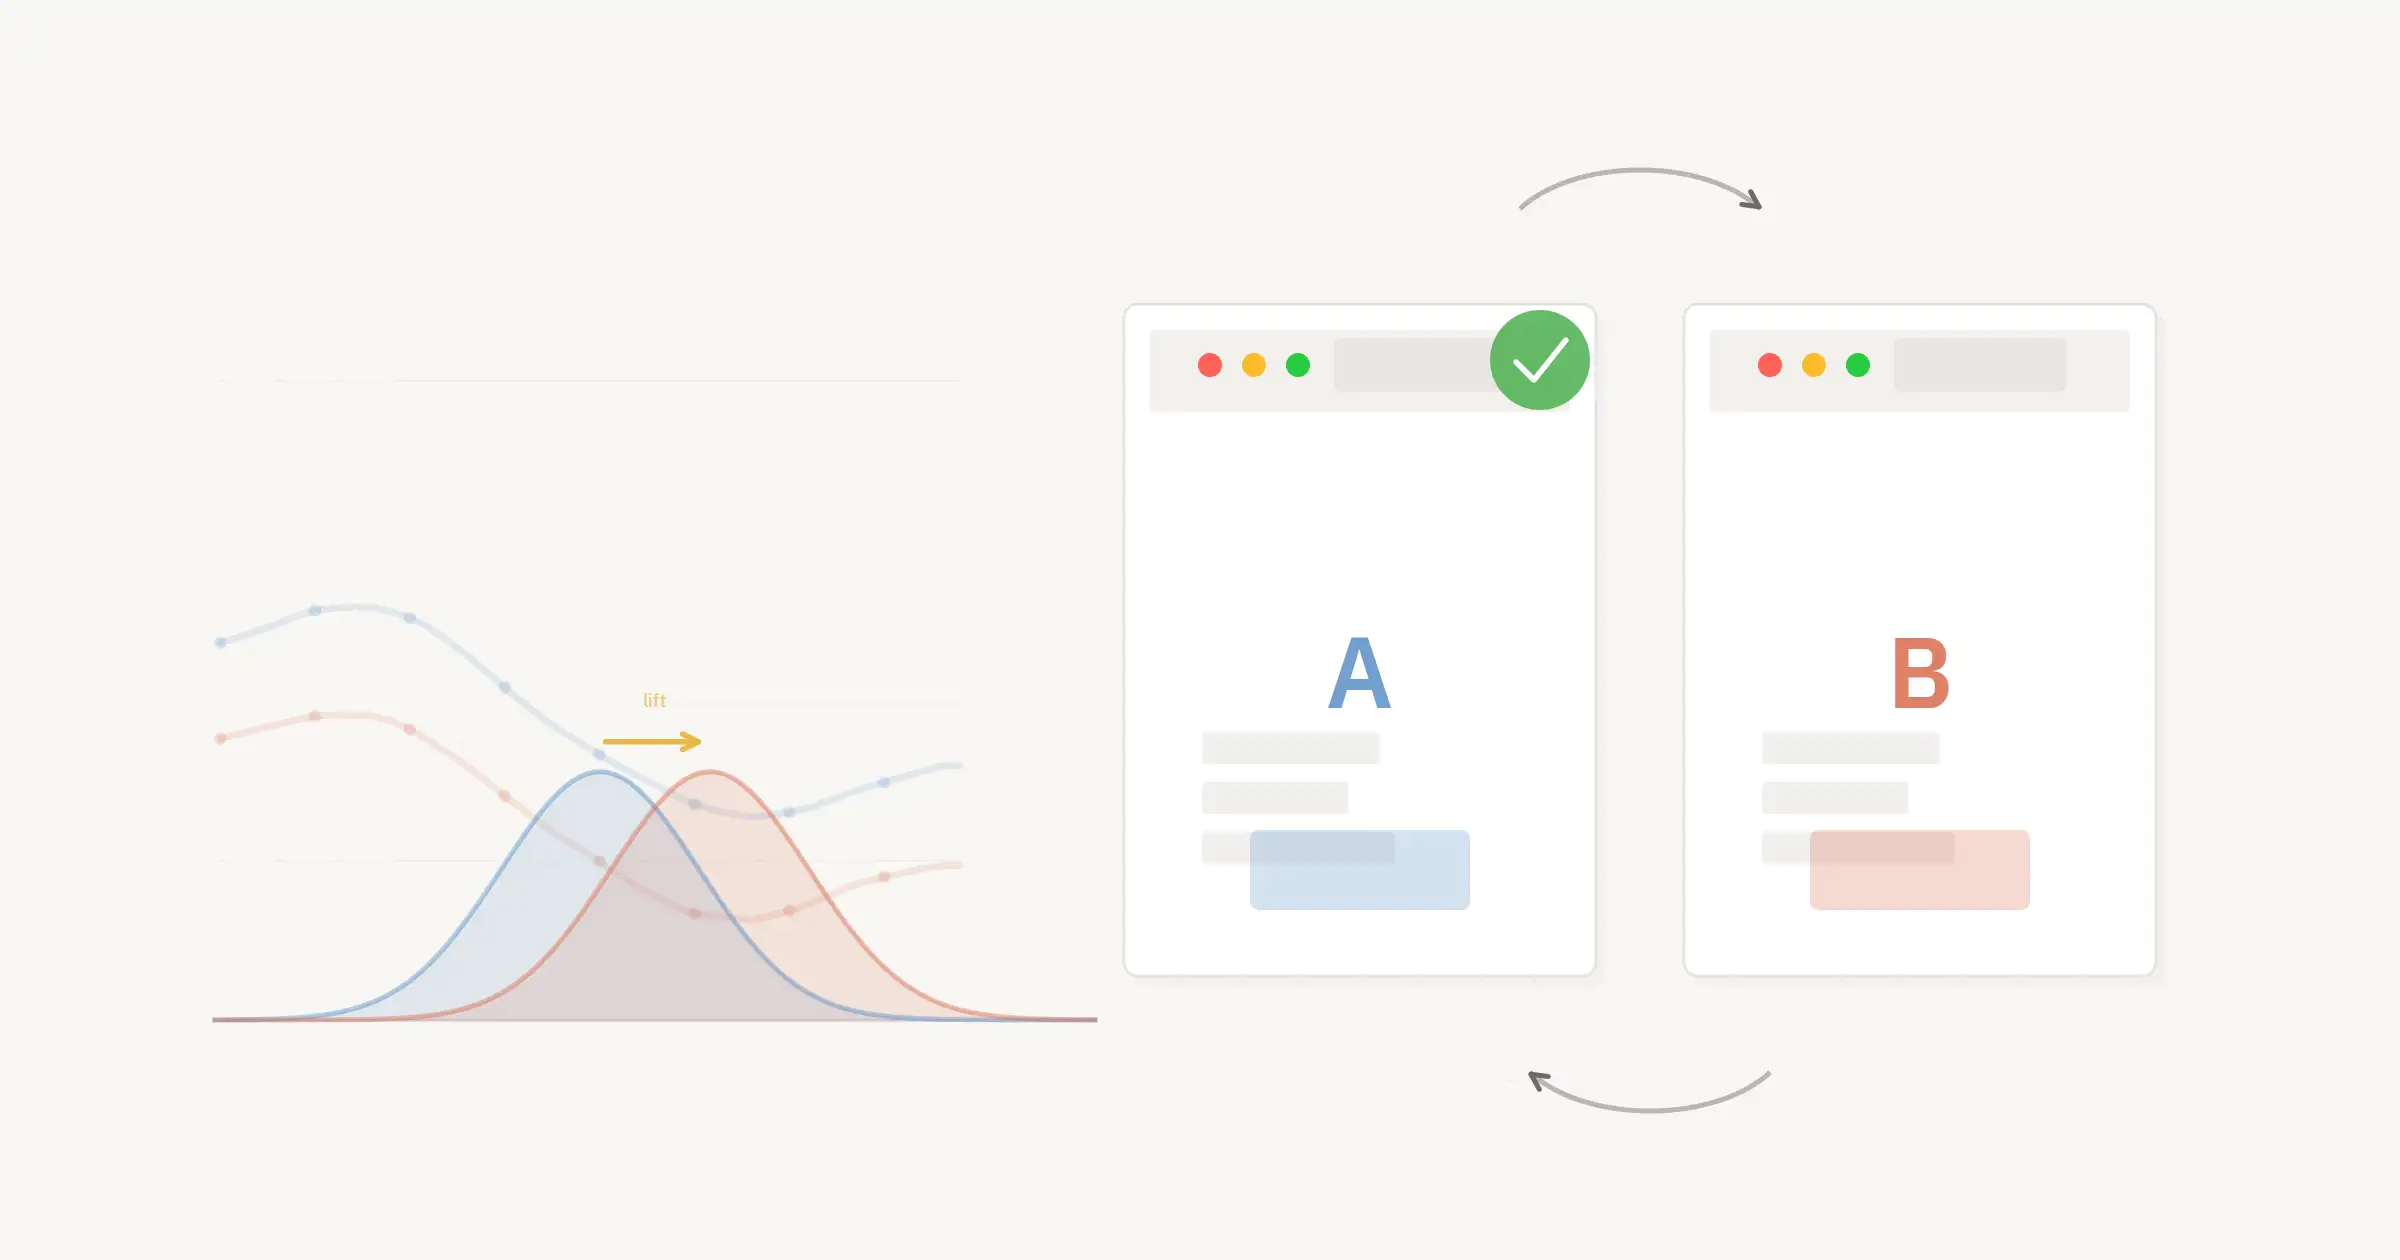
The concept is straightforward. You take your existing experience - the current checkout button, the current email subject line, the current pricing page - and call it Variation A, the control. Then you create a modified version and call it Variation B, the test. You randomly split your visitors into two groups. One group sees the control, the other sees the test. Both groups exist at the same time, under the same conditions. The only difference between them is the change you’re testing.

Visitors are randomly assigned to groups so both experience the same external conditions. The only difference is the change being tested.
This simultaneous comparison is what makes A/B testing powerful. Because both groups experience the same external conditions - same day of the week, same promotions, same competitor activity - any difference in results is much more likely caused by your change rather than something outside your control.
You don’t need to expose everyone to the test, either. A common approach is sending 80% of traffic to the control and 20% to the test variation. That way, if the test variation hurts performance, the damage is limited to a smaller group. As confidence grows, you can shift more traffic toward the winning version.
And A/B testing isn’t limited to two options. A/B/n testing adds more variations - you might test three different headlines or four different layouts against each other. The same principles apply, but you need more visitors to get reliable results because the traffic is split across more groups.
Why you can’t just eyeball the results
Here’s where most people get tripped up. Say your test runs for a week and the new button shows a 6% conversion rate while the old button shows 5%. The new button wins, right?
Not necessarily. That difference might be real, or it might be random noise. If you flipped a coin 100 times and got 53 heads, you wouldn’t conclude the coin is biased. Same principle here. Small differences on small sample sizes are often just luck.
This is why A/B testing relies on statistics - not to make things complicated, but to help you tell the difference between a real signal and random variation in your data.
Confidence intervals: the honest range
When you measure a conversion rate from a sample of your visitors, you’re getting an estimate, not the absolute truth. The real conversion rate for your entire audience could be slightly higher or lower. A confidence interval puts honest boundaries around that estimate.
Say your test group shows a 5% conversion rate. A 90% confidence interval might tell you the true rate is somewhere between 3.5% and 6.5%. That means: if you ran this same test many times, 90% of the time the real answer would land inside that range.

The blue region represents the range where the true value most likely falls. The terracotta tails represent the small probability that the true value lies outside the confidence interval.
The key insight: the more visitors you measure, the narrower the interval gets. Early in a test, your confidence interval might be wide - say 2% to 8%. After collecting more data, it tightens - maybe 4.2% to 5.8%. That narrowing is your test becoming more certain.
This is also why patience matters. Peeking at results too early, when intervals are still wide, is one of the most common mistakes in A/B testing. The numbers look dramatic because the uncertainty is large, not because the effect is large.
Statistical significance: can you trust the difference?
Once you have confidence intervals for both variations, the next question is whether the difference between them is real. That’s what statistical significance measures.
Think of it this way: if the confidence intervals for your two variations overlap a lot, you can’t confidently say one is better than the other. The overlap means both variations could plausibly have the same true conversion rate. But if the intervals barely overlap - or don’t overlap at all - you have stronger evidence that the difference is real.

When confidence intervals overlap heavily, there’s no reliable difference. When they separate, you can be more confident the change had a real effect.
Most A/B testing tools use a 95% significance threshold. That means the tool is telling you there’s only a 5% chance the observed difference is due to random variation rather than a genuine effect of your change. It’s not a guarantee, but it’s a reasonable level of confidence for most business decisions.
A result that isn’t statistically significant doesn’t mean your change had no effect. It means you don’t have enough evidence to be sure. Sometimes the effect is real but small, and you’d need more data to detect it. Other times, there’s genuinely no meaningful difference - and that’s useful information too.
Common mistakes that ruin A/B tests
Even with good tools, A/B tests go wrong in predictable ways.
Stopping too early. You see a big difference after two days and call a winner. But the early numbers were noisy, and the “winner” regresses to the same performance as the control by the end of the week. Always let the test reach its planned sample size.

Early in a test, both lines swing wildly. The true difference only becomes clear once enough visitors have been measured - which is why premature stopping is the most common A/B testing mistake.
Testing too many things at once. If Variation B changes the button color, the headline, the price, and the layout, you won’t know which change caused the result. Test one meaningful change at a time, or use multivariate testing if you need to test combinations.
Ignoring segment effects. Your test might show no overall difference, but the new version could be much better for mobile users and much worse for desktop users. Those effects cancel each other out in the aggregate. Check key segments before dismissing a test as inconclusive.
Running tests without enough traffic. If your page gets 200 visitors a week, you probably can’t detect anything short of a massive difference. Use a sample size calculator before launching a test. You might find you need to run it for months - and that’s OK. It’s better than making a decision on bad data.
When A/B testing is worth it - and when it isn’t
A/B testing is most valuable when the stakes are meaningful and you have enough traffic to detect a difference. High-traffic checkout pages, email campaigns sent to large lists, onboarding flows with thousands of new users per week - these are ideal candidates.
It’s less useful when traffic is low, when the change is trivial, or when you’re making a strategic bet that won’t show results in a conversion metric. Not every product decision needs a test. Sometimes the right call is to ship the change, monitor the outcome, and move on. Testing is a tool, not a religion.
The companies with the strongest experimentation cultures - the Googles, the Netflixes, the Bookings - don’t test everything. They test the things where being wrong is expensive and the data can actually resolve the question.
So what?
If your team is running A/B tests, ask two questions before trusting any result: did the test reach the planned sample size, and is the result statistically significant? If the answer to either is no, the test isn’t done yet - no matter how promising the early numbers look. And if you’re not running tests yet, start with your highest-traffic page and one clear hypothesis. You don’t need a sophisticated platform to get value from the basic discipline of comparing two options with real data.
To learn more about the math behind A/B testing, read The Math Behind A/B Testing.